Investment as a Microcosm of Life Investment is a microcosm of life, a scaled-down version of it. People immersed in the investment world face the same temptations and drives of fear and greed.
The raw monetary transactions in the investment world amplify these emotions, leading to a complete loss of self in our thoughts and moods. In practice, we should not aim to capture both bullish and bearish trends fully.
Instead, we should operate solely in alignment with the main trend, focusing on single-sided opportunities. The market is relentless; even if we miss a good opportunity, as long as we maintain patience and control our greed, another favorable trading chance will always come.
BOLL Indicator The BOLL indicator, also known as the Bollinger Bands, is a simple yet practical technical analysis tool derived from the statistical concept of standard deviation. It is widely used for studying medium- to long-term market trends.
Highly regarded by institutional investors, the BOLL indicator has significant practical value for stock trading and is an essential technique for retail investors to master. Definition The BOLL indicator, also known as the Bollinger Bands or price channel line, shows the trajectory of stock prices moving within a defined range.
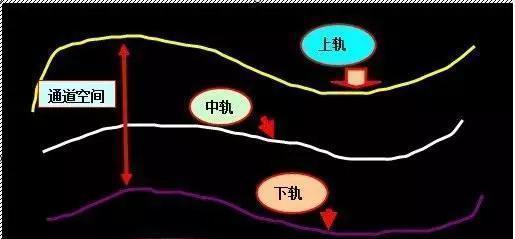
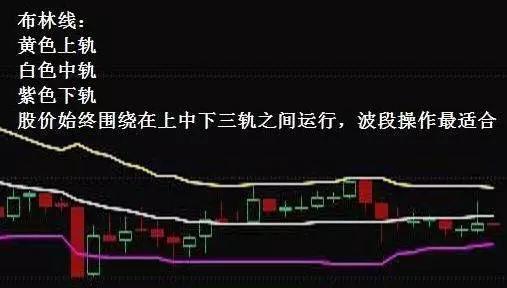
The BOLL indicator comprises three lines: the upper band, the middle band, and the lower band. The upper band is represented by a yellow line, the middle band by a white line, and the lower band by a purple-red line. Like other technical indicators, you don’t need to calculate the BOLL indicator during actual trading—understanding how to use it is sufficient.
- The upper, middle, and lower bands of the BOLL indicator form a price channel, the range of which fluctuates with stock price movements.
- Under normal circumstances, stock prices should always stay within the price channel. If prices move outside the channel, it indicates extreme market conditions.
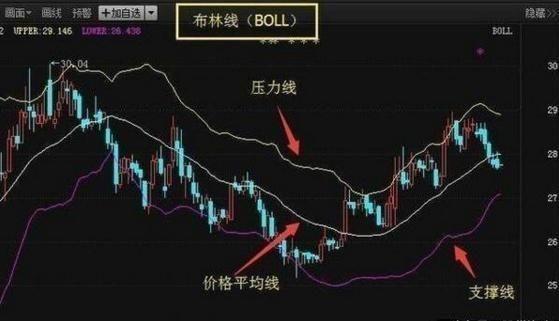
- The upper and lower bands indicate the highest and lowest safe price levels.
- The bands can provide support or resistance to stock prices, depending on the situation.
- When stock prices move above the middle band, the trend is bullish. When prices are below the middle band, the trend is bearish.
Interpreting the Bollinger Bands
When prices are between the middle and upper bands, the market is bullish as long as the price does not fall below the middle band.
When prices are between the middle and lower bands, the market is bearish as long as the price does not rise above the middle band.
When prices follow the upper band, the market shows a unilateral bullish trend. In such cases, hold long positions until prices leave the upper band region.
When prices follow the lower band, the market shows a unilateral bearish trend. Hold short positions until prices leave the lower band region.
When prices fluctuate around the middle band, the market is in a consolidation phase, characterized by oscillations.
- This phase is challenging for trend followers, often leading to losses. The recommended strategy during such times is to stay out of the market and avoid trading until the direction becomes clear.
Bollinger Band Applications From a practical perspective:
When prices return from above the upper band or below the lower band, it signals a transition from extreme regions to regular levels.
If a new high or low is established without returning to extreme regions, the stock enters a "medium correction" phase.
In such cases, focus on analyzing the duration of this correction based on the narrowing Bollinger Band. It is vital to use bands of different timeframes to predict transitions effectively.
When prices initially rebound or decline and then reverse, the upper and lower bands often become critical resistance and support levels.
Conclusion Your belief in trends determines the extent of your success. As a trend follower, trusting that the trend will persist and accepting potential pullbacks is essential to capture significant opportunities.
Many fail to understand this simple principle. They aim to avoid pullbacks, only to close positions prematurely and miss substantial gains.